CS 440 Projects
An Overview of Some Possible Projects
Introduction
The ideas below are not fully formed, ready-to-submit projects. They are potential starting points for projects — ideas that you could extend or retarget to create your own project. The project ideas below would need to be fleshed out in much more detail before they could be submitted for approval. (See the guidelines for more information on expectations for project proposals.) You would need to get more specific about potential features, implementation approaches (e.g. frameworks to be used, etc), challenges, and an anticipated timeline. After skimming the proposals below, please indicate interest in one or more projects (or add your own) here.
Power Management Dashboard
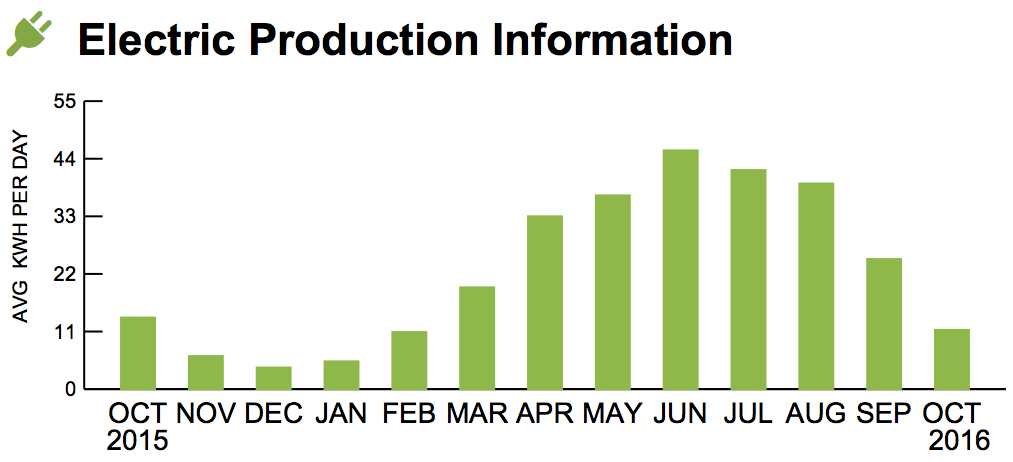
My house has a power-monitoring system that tracks the power usage of various circuits in the house as well as the power generated by our solar panels. You can see a real-time display online. (This time of year we're not making much power. Take a look at some historical data for examples of a good summer day: June 19th 2016, June 19th 2016, July 24th 2016.) The monitoring system I use, eGauge, is pretty widely used and pushes its data to the cloud where it's easy to access. The data could be used to answer questions like:
- How does today compare to yesterday in terms of production and consumption?
- How does today compare to this day a year ago?
- How close to net-zero are we for the past year?
- How close to net-zero will we be at the end of this calendar year?
- Requires estimating solar generation patterns
- Perhaps estimating weather patterns for rest of year, etc.
- How much have I saved given the power produced?
- How much of the power consumption for the day/month/year went to:
- Heating the house
- Heating water
- Pumping water
- etc...
Anyone with an eGauge can read data directly via a link like http://egauge21244.egaug.es/cgi-bin/egauge?tot&v1, which returns an XML-formatted response. (Your browser might hide the XML tags in the response if you don't chose to view the raw source). The API is documented online, so it should be possible to build a "dashboard" summarizing power stats, with options to display some or all of the results above. In addition to directly measured values, one could also use the power data to estimate other quantities of interest. For example:
- How much water is the house using per day?
- Could base estimate on minutes of pumping during a day
- Total power used by pump might be more accurate measure?
- Can we determine how much hot water has been used?
- Should be related to power used by water heater...
- What's the impact of our water softener?
- The well pump runs for ~2 hours each time it recharges!
- How much water is it using?
- How much power does it take to pump all that water?
There might also be opportunities to look for correlations between various categories of power consumption. For example, can you detect when a shower is being taken? It might be possible to watch for times when the pump runs for roughly the right amount of time and the water heater turns on. If so, you could estimate the total amount of power being used by showers during the day. Can you tell showers from baths?
Any system you create could potentially summarize information for any eGauge user, though you'd need to do some interactive setup with the user first. (E.g. Get the URL for their device, query the site to get the power-usage categories, ask the user which to monitor, etc.) One of the nice things about this project is that it could be done somewhat incrementally — you can get the basic features implemented and then add some of the fancier stuff as time permits. Note that some of these features would require storing data from previous days or years so comparisons can be drawn, while others could be done with perhaps a single day's worth of data.
Catch That Toilet!
This is a smaller-scale project that also makes use of the power data from the eGauge. We have a septic system, and it requires a pump since the drainfield is slightly uphill from the tank. To avoid damaging the drainfield, the pump only runs for a couple of minutes at a time and there's a 6-hour interval between runs. That's fine under normal circumstances, but on a number of occasions the toilet has failed to stop flushing properly. If left running overnight it can overflow the septic tank since the septic pump can't keep up. That's bad. There's an alarm that goes off when the tank level gets too high, but we can't hear it inside the house, and by the time the level gets that high the toilet has been running for many hours and the situation is already dire.
An online monitoring tool could watch when the well pump runs and send an email and/or text message if it runs for more than a preset number of minutes. Ideally, the system would communicate with the eGauge to see which quantities it should monitor, then present the user with the ability to set "watches" on any of them.
Watching for cycles could be valuable as well. If I leave the coffee machine on, for example, the heating element cycles on and off every few minutes. Detecting a runaway coffee machine would therefore require recognizing a cycle of activity that had been going on for an extended period. I've seen a similar issue with the water heater: If the hot water is left dripping slightly, it can cause the water heater to run periodically in ways that might be possible to detect.
Ideally, it would be possible to schedule watch periods for various circuits/devices. My wife uses the garage apartment as a teaching studio a few days a week, and turns the heater on in advance of her teaching days so it's warm for her students. She often forgets to turn the heater off at the end of a teaching day (or few days) though. It would be nice to schedule a watch from Thursday evening through Monday morning, for example, that would detect the heater running for more than a few minutes. On other days there's no cause for alarm — the heater is supposed to be running. Similarly, I know that the pump runs for a couple of hours every few weeks when the water softener recharges. I can't anticipate which day it will recharge, but I know it always happens at 1:00 in the morning, so it would be nice to exclude any pump-running alarms from midnight to 3:00am, for example. (That might miss a running toilet for a few hours, but it has to run for 8-10 hours before the tank reaches its limits.)
The examples above are all scenarios where using too much power is a bad thing, but there are also situations where I'd want to be notified if power consumption stops. For example, we have an outdoor chest freezer that sometimes trips its breaker and stops running. It's possible to detect this by looking at the power-consumption data — you could watch for the pattern of the freezer cycling on and off and send an alert if that pattern stops, or you could look at the average power consumption on that particular circuit for the past N minutes and complain if it drops too low.
A fully general system would automatically detect the names of the circuits being monitored, and have a user-friendly interface for setting a variety of "notifications" — some for using too much power, some for not enough, maybe some for particular patterns. Implementing this project will require some networking and a web-based interface, but can be done without storing any power-consumption data. If time permits or the team is large, it could be possible to learn the power-usage patterns in the house and issue alerts if those patterns change.
Inventory Tracking App
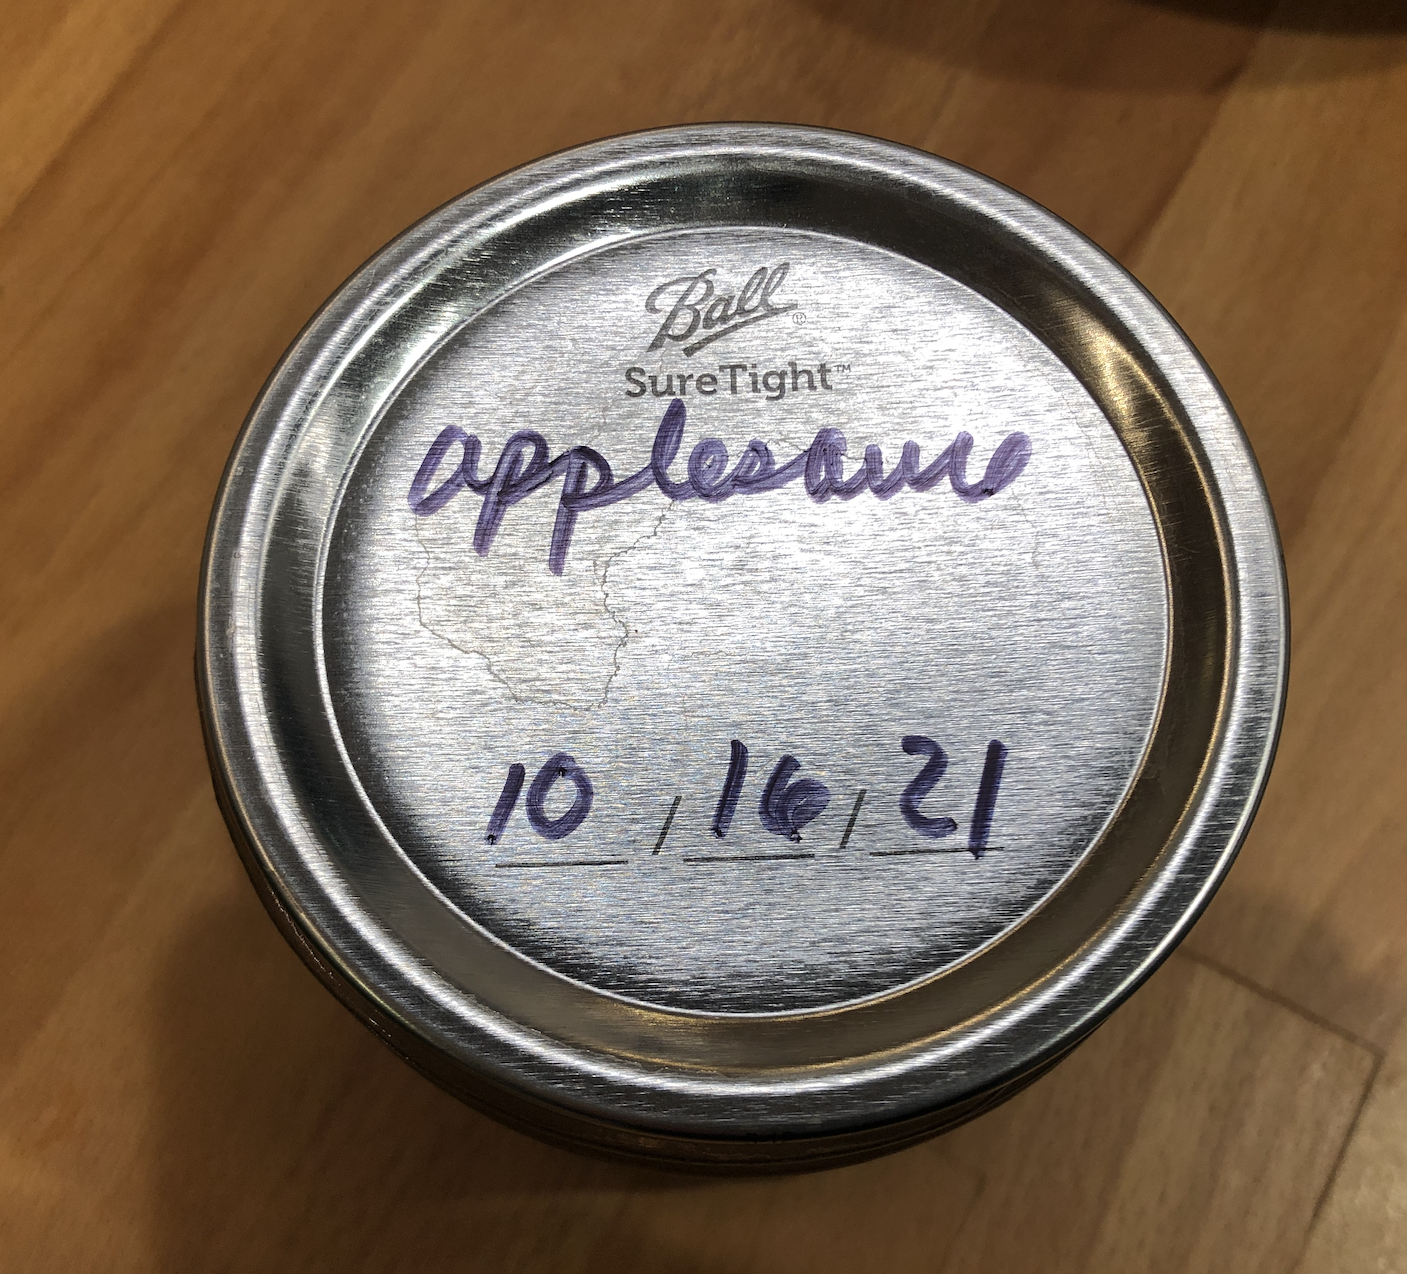
My wife has a gardening addiction, which has led to a canning addiction as well. We could easily survive the coming zombie apocalypse on this year's canned goods alone — we're talking hundreds and hundreds of jars of green beans, tomatoes, applesauce, pasta sauce, salsa, jam, etc. With so many jars crammed onto the shelves it's easy to lose track of what's actually there. What we need is a mobile app to help track inventory. For example, we could put QR codes on each shelf, or section of shelf. When adding stock to the shelves one could scan the code on the shelf, then scan a code on the jar being added to the shelf, and the system would remember that it was there. Maybe there's a way to do it without QR codes on the jars. For example, maybe you could take a photo of the jar lid and use that as a "fingerprint". Log it when putting the jar on the shelf, and take a photo again when using the jar to take it out of inventory.
Once you've got data about what's on the shelves, I can imagine a variety of ways to use it. You could generate reports (maybe even visualizations) about what's still on the shelves and where. You could generate alerts on items that are nearing a user-set expiration date. You could track which items went "out of stock" most rapidly and suggest making more for next year.
It would be sufficient to have a mobile app that kept the database on a single device, and used that device's camera to scan QR codes, etc. A fancier version might keep the database in the cloud somewhere and support multiple devices. Multiple users could scan as items are added to or removed from inventory and the database would update appropriately.
Note that while I've selfishly motivated this inventory tracking project with our own household needs in mind, if done properly a tool like this could be used to keep track of almost anything — clothes in your closet, tools in your shop, groceries in your kitchen cupboards, books in your library, etc. Heck, you might even be able to make some money off of it...
Logic Circuit Visualizations
Professor Smith is hoping to develop some JavaScript applets to help visualize logic circuits in CSCI 281. He has some initial examples online, but is hoping to build more complete and interactive examples. He says: "It would be a JavaScript applet to draw functional circuits, as figures. I have a version that I use for Architecture, but I'm not happy with it for various reasons. The new version would entail:
- Writing JavaScript to create a dynamic web page.
- Making use of vector-based SVG graphics.
- Particular emphasis on making the structures extensible, so that more circuits can be added later.
- Also a strong emphasis on appearance — it has to look good to keep students interested.
Consult Prof. Smith for additional details.
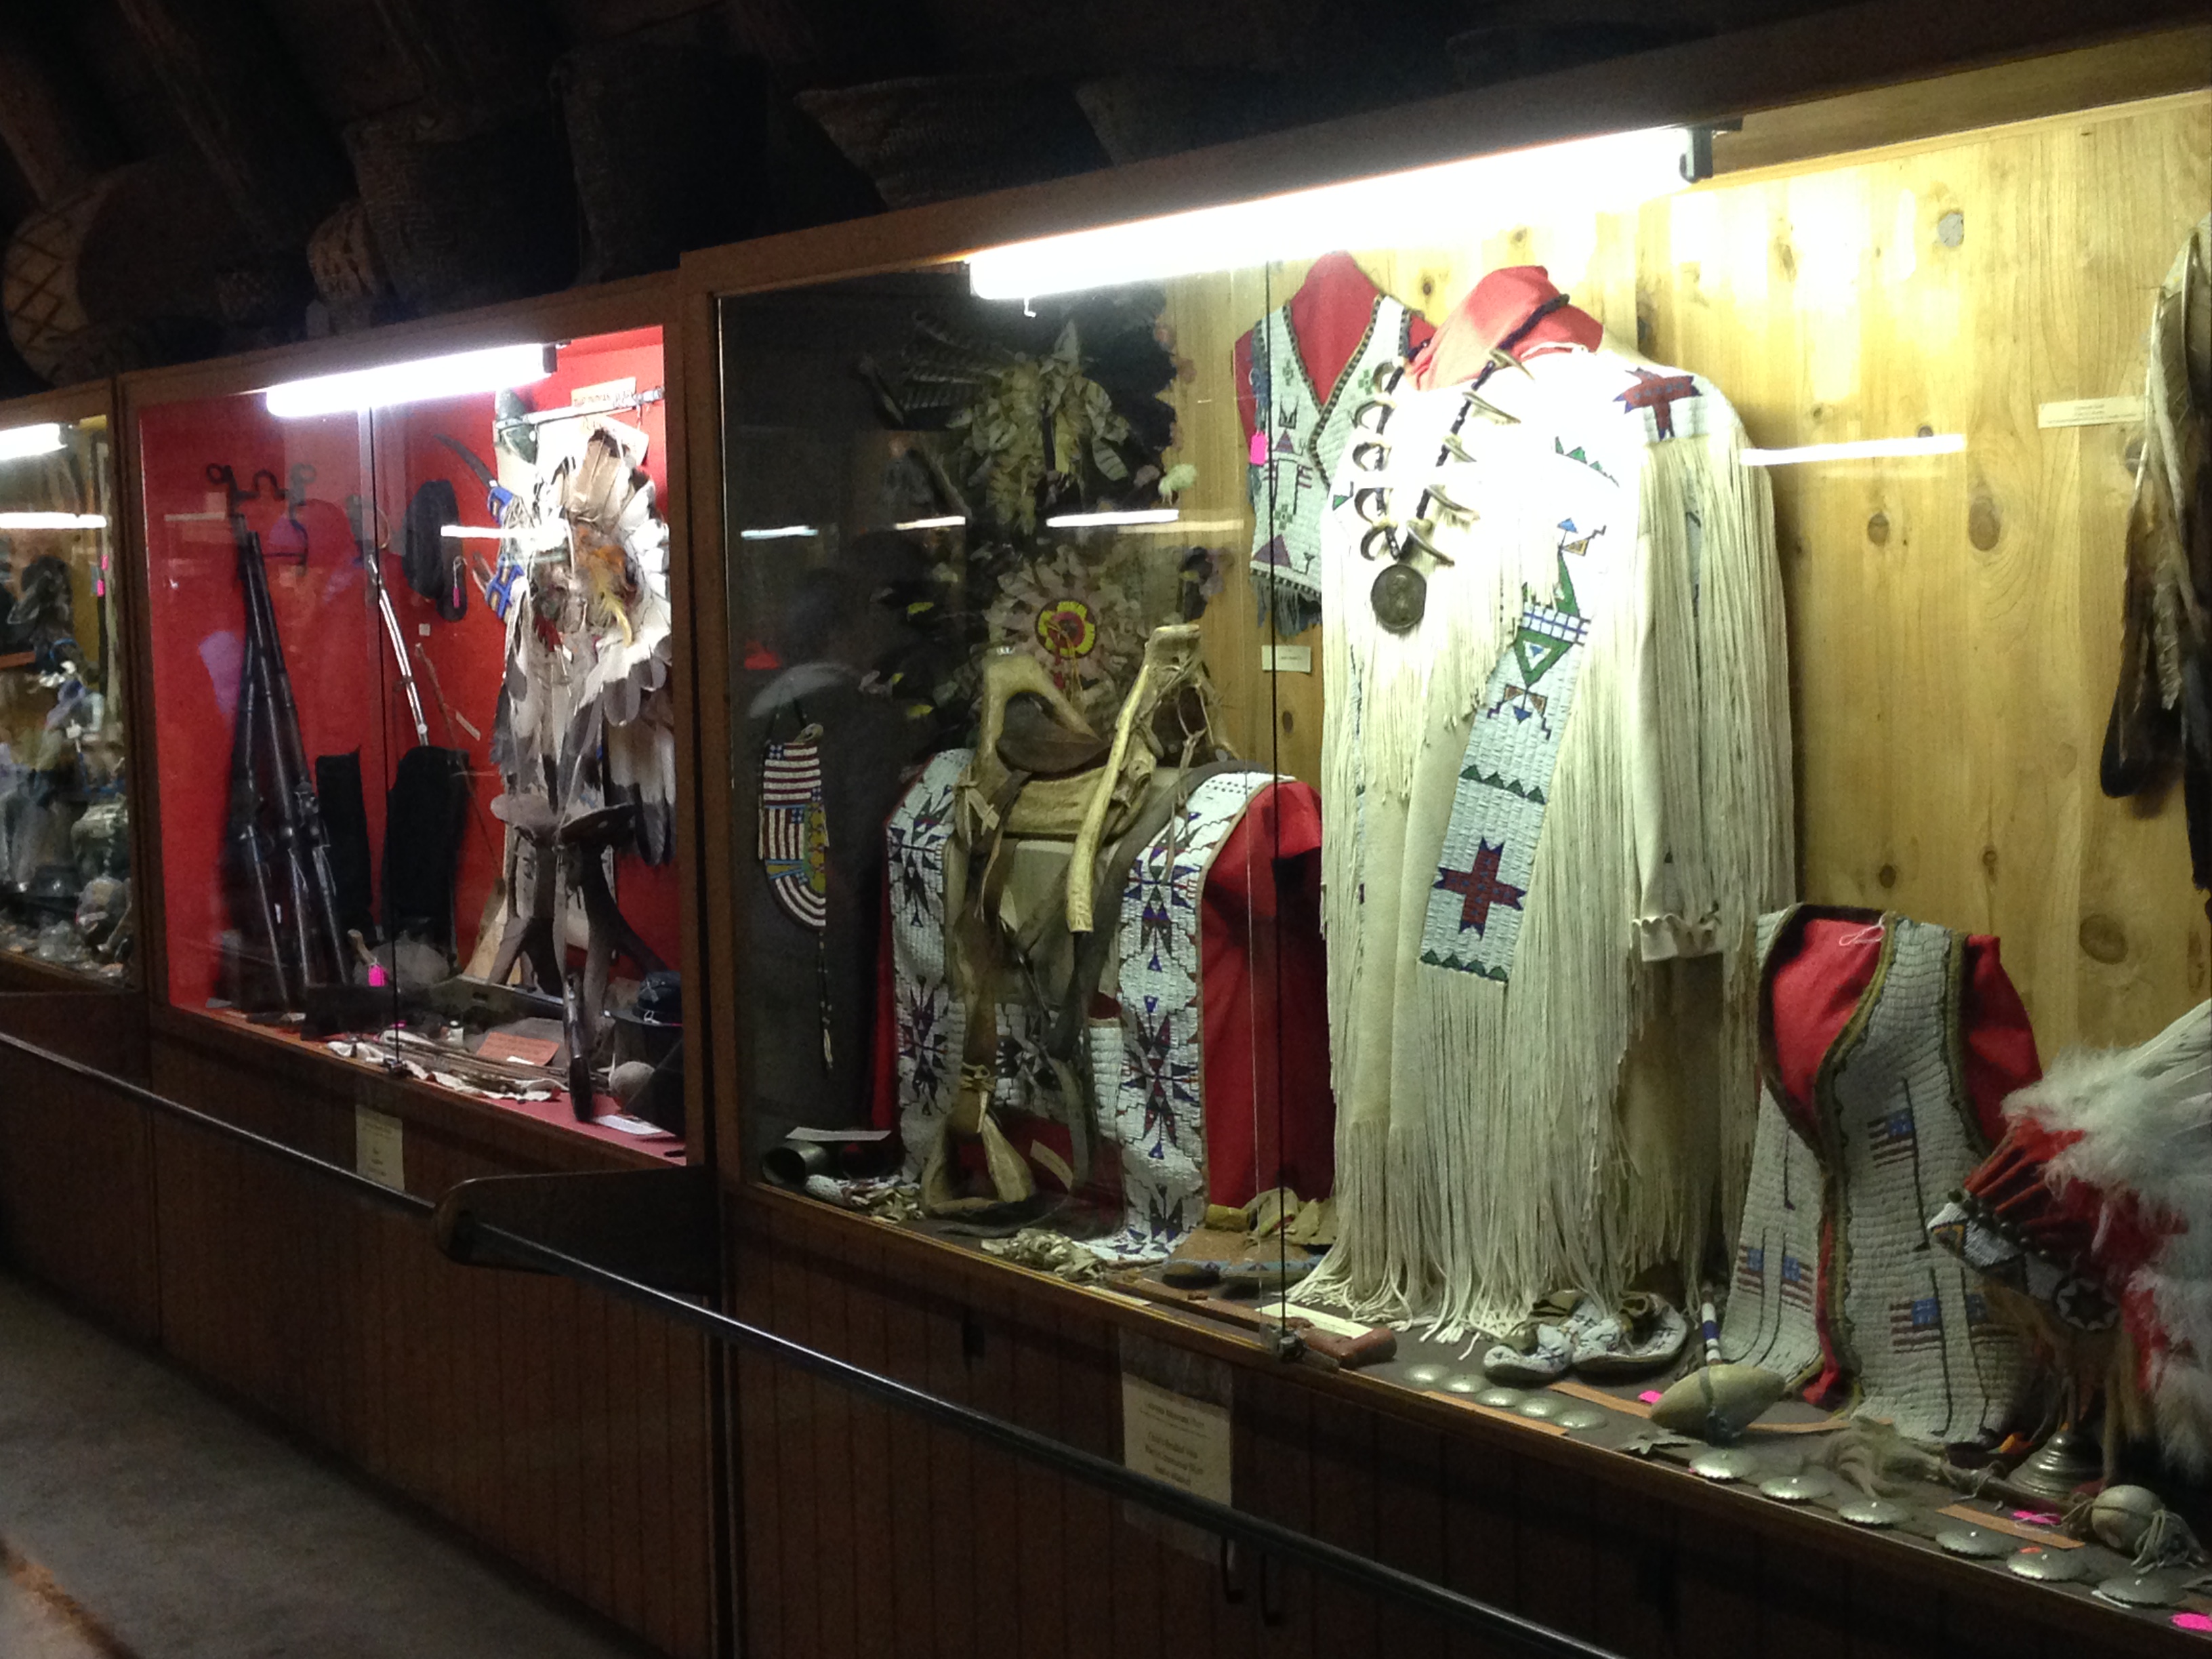
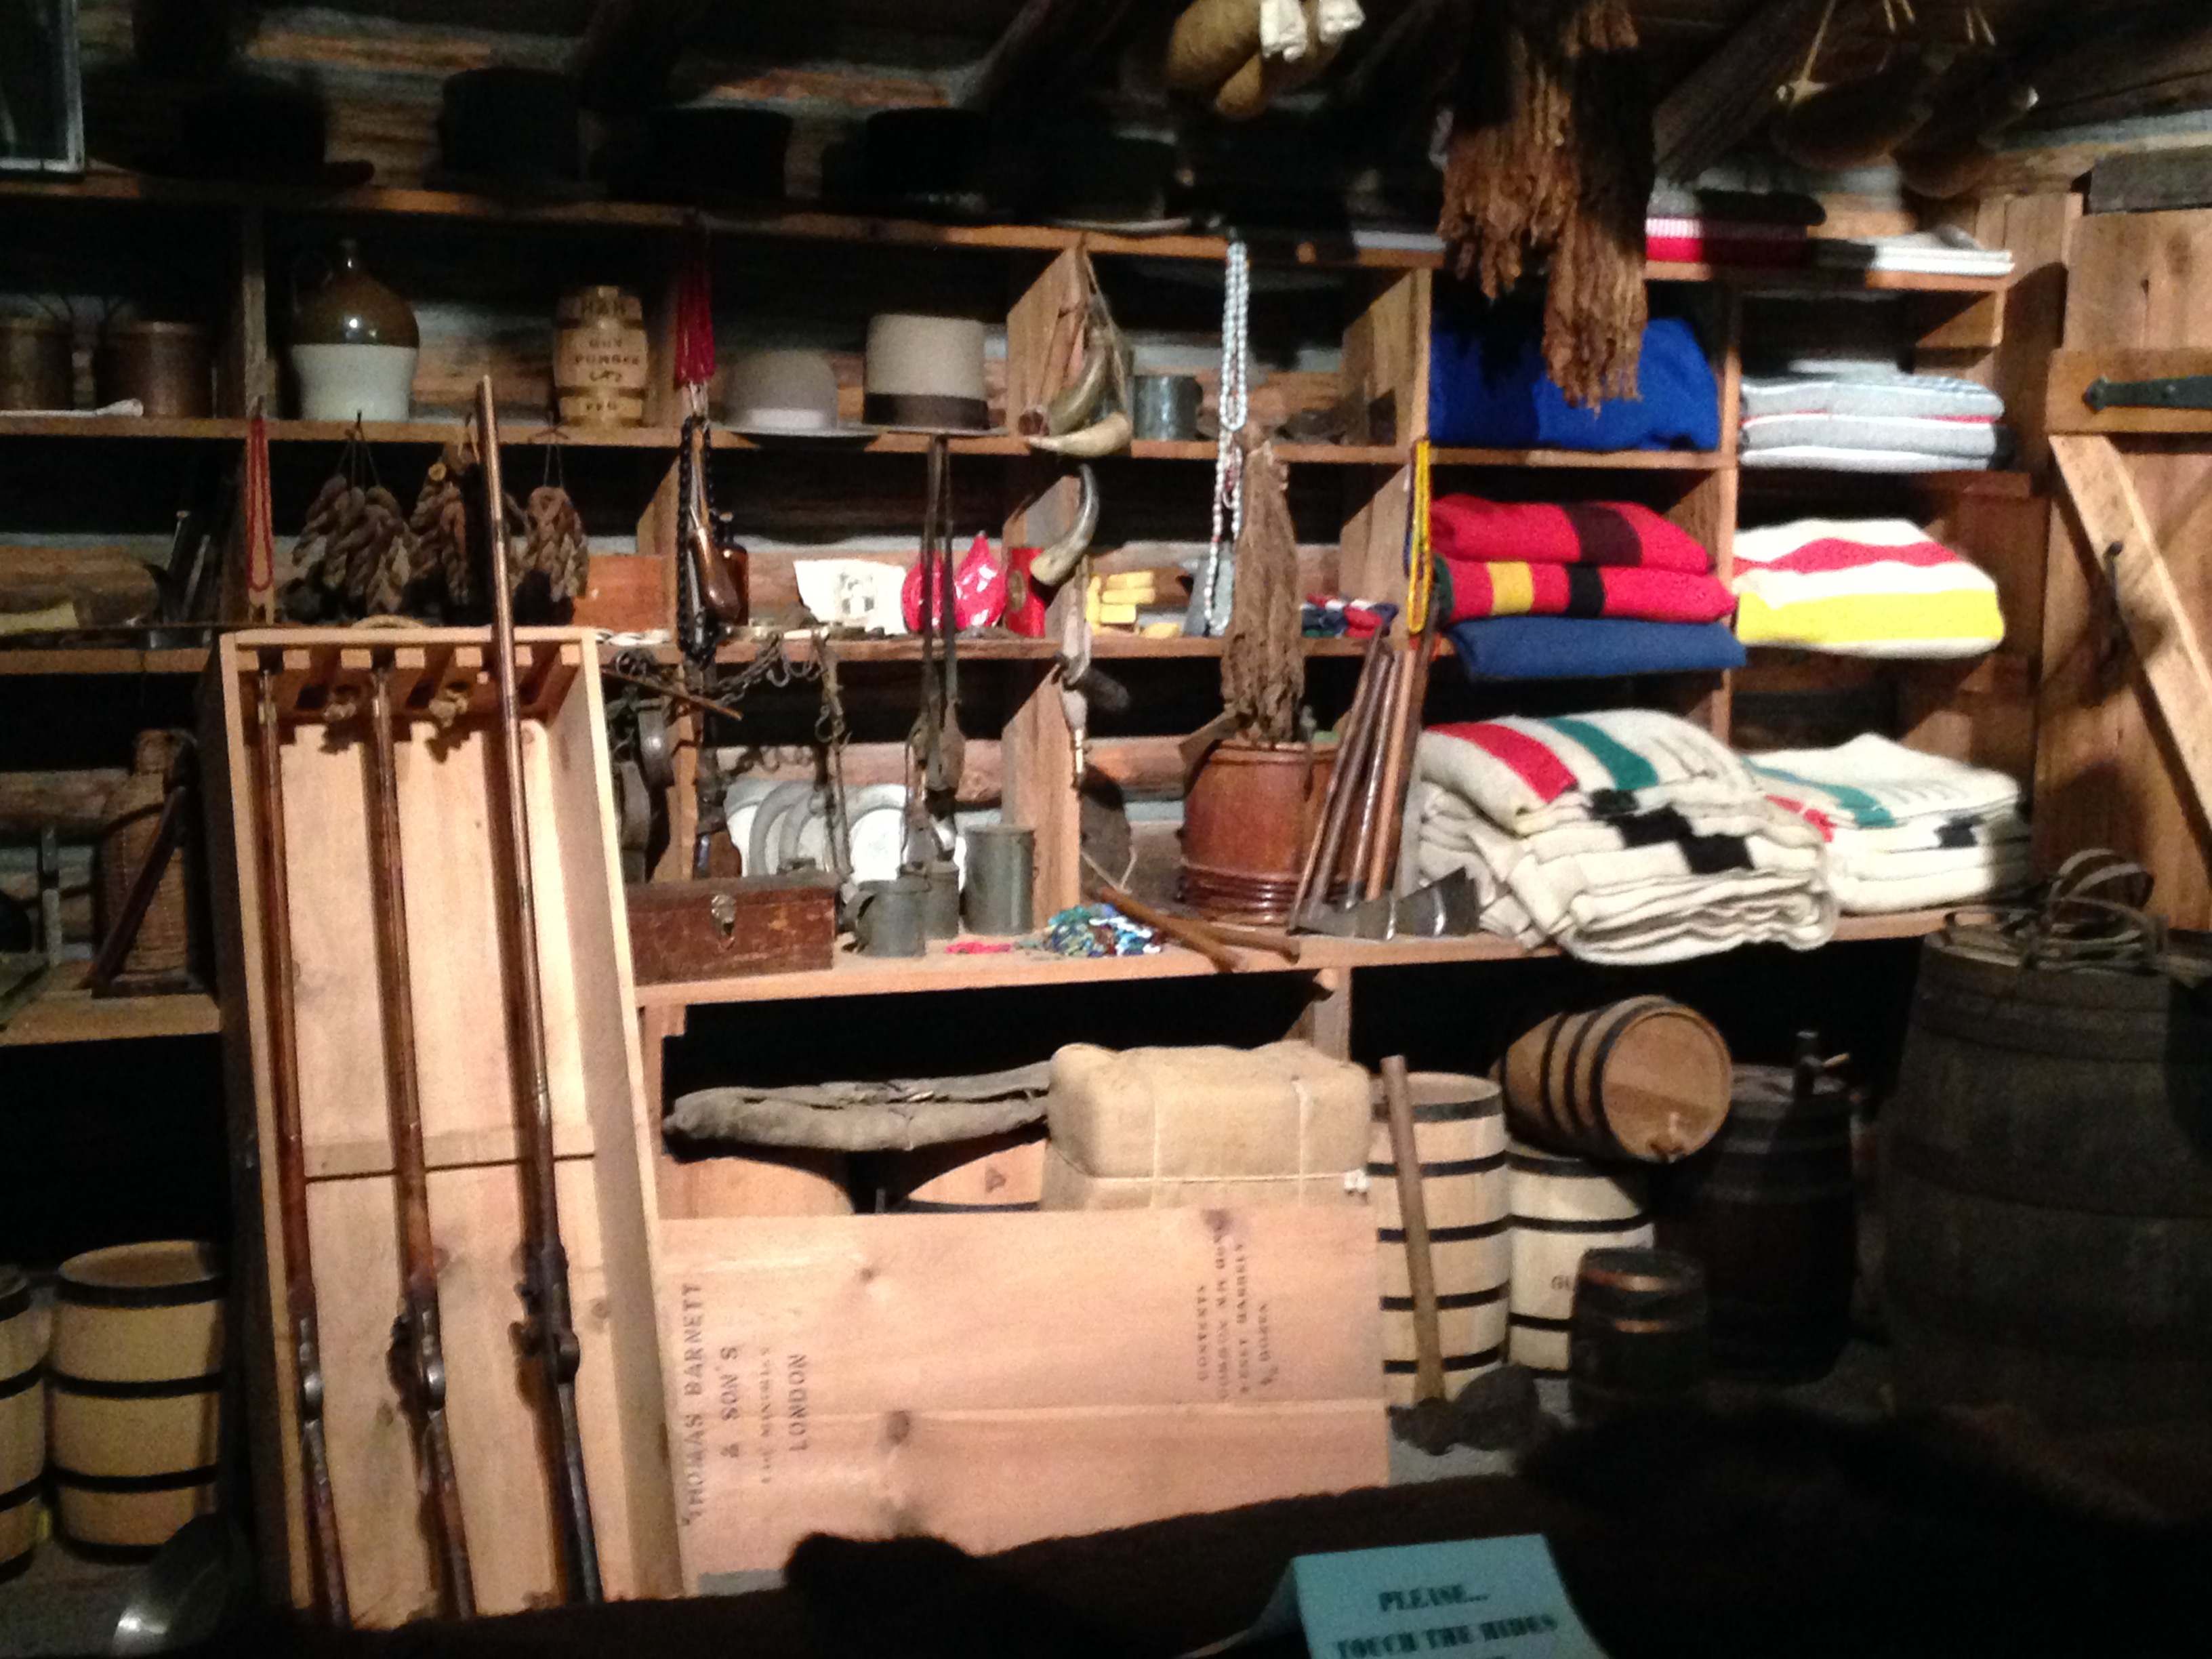
Museum Support
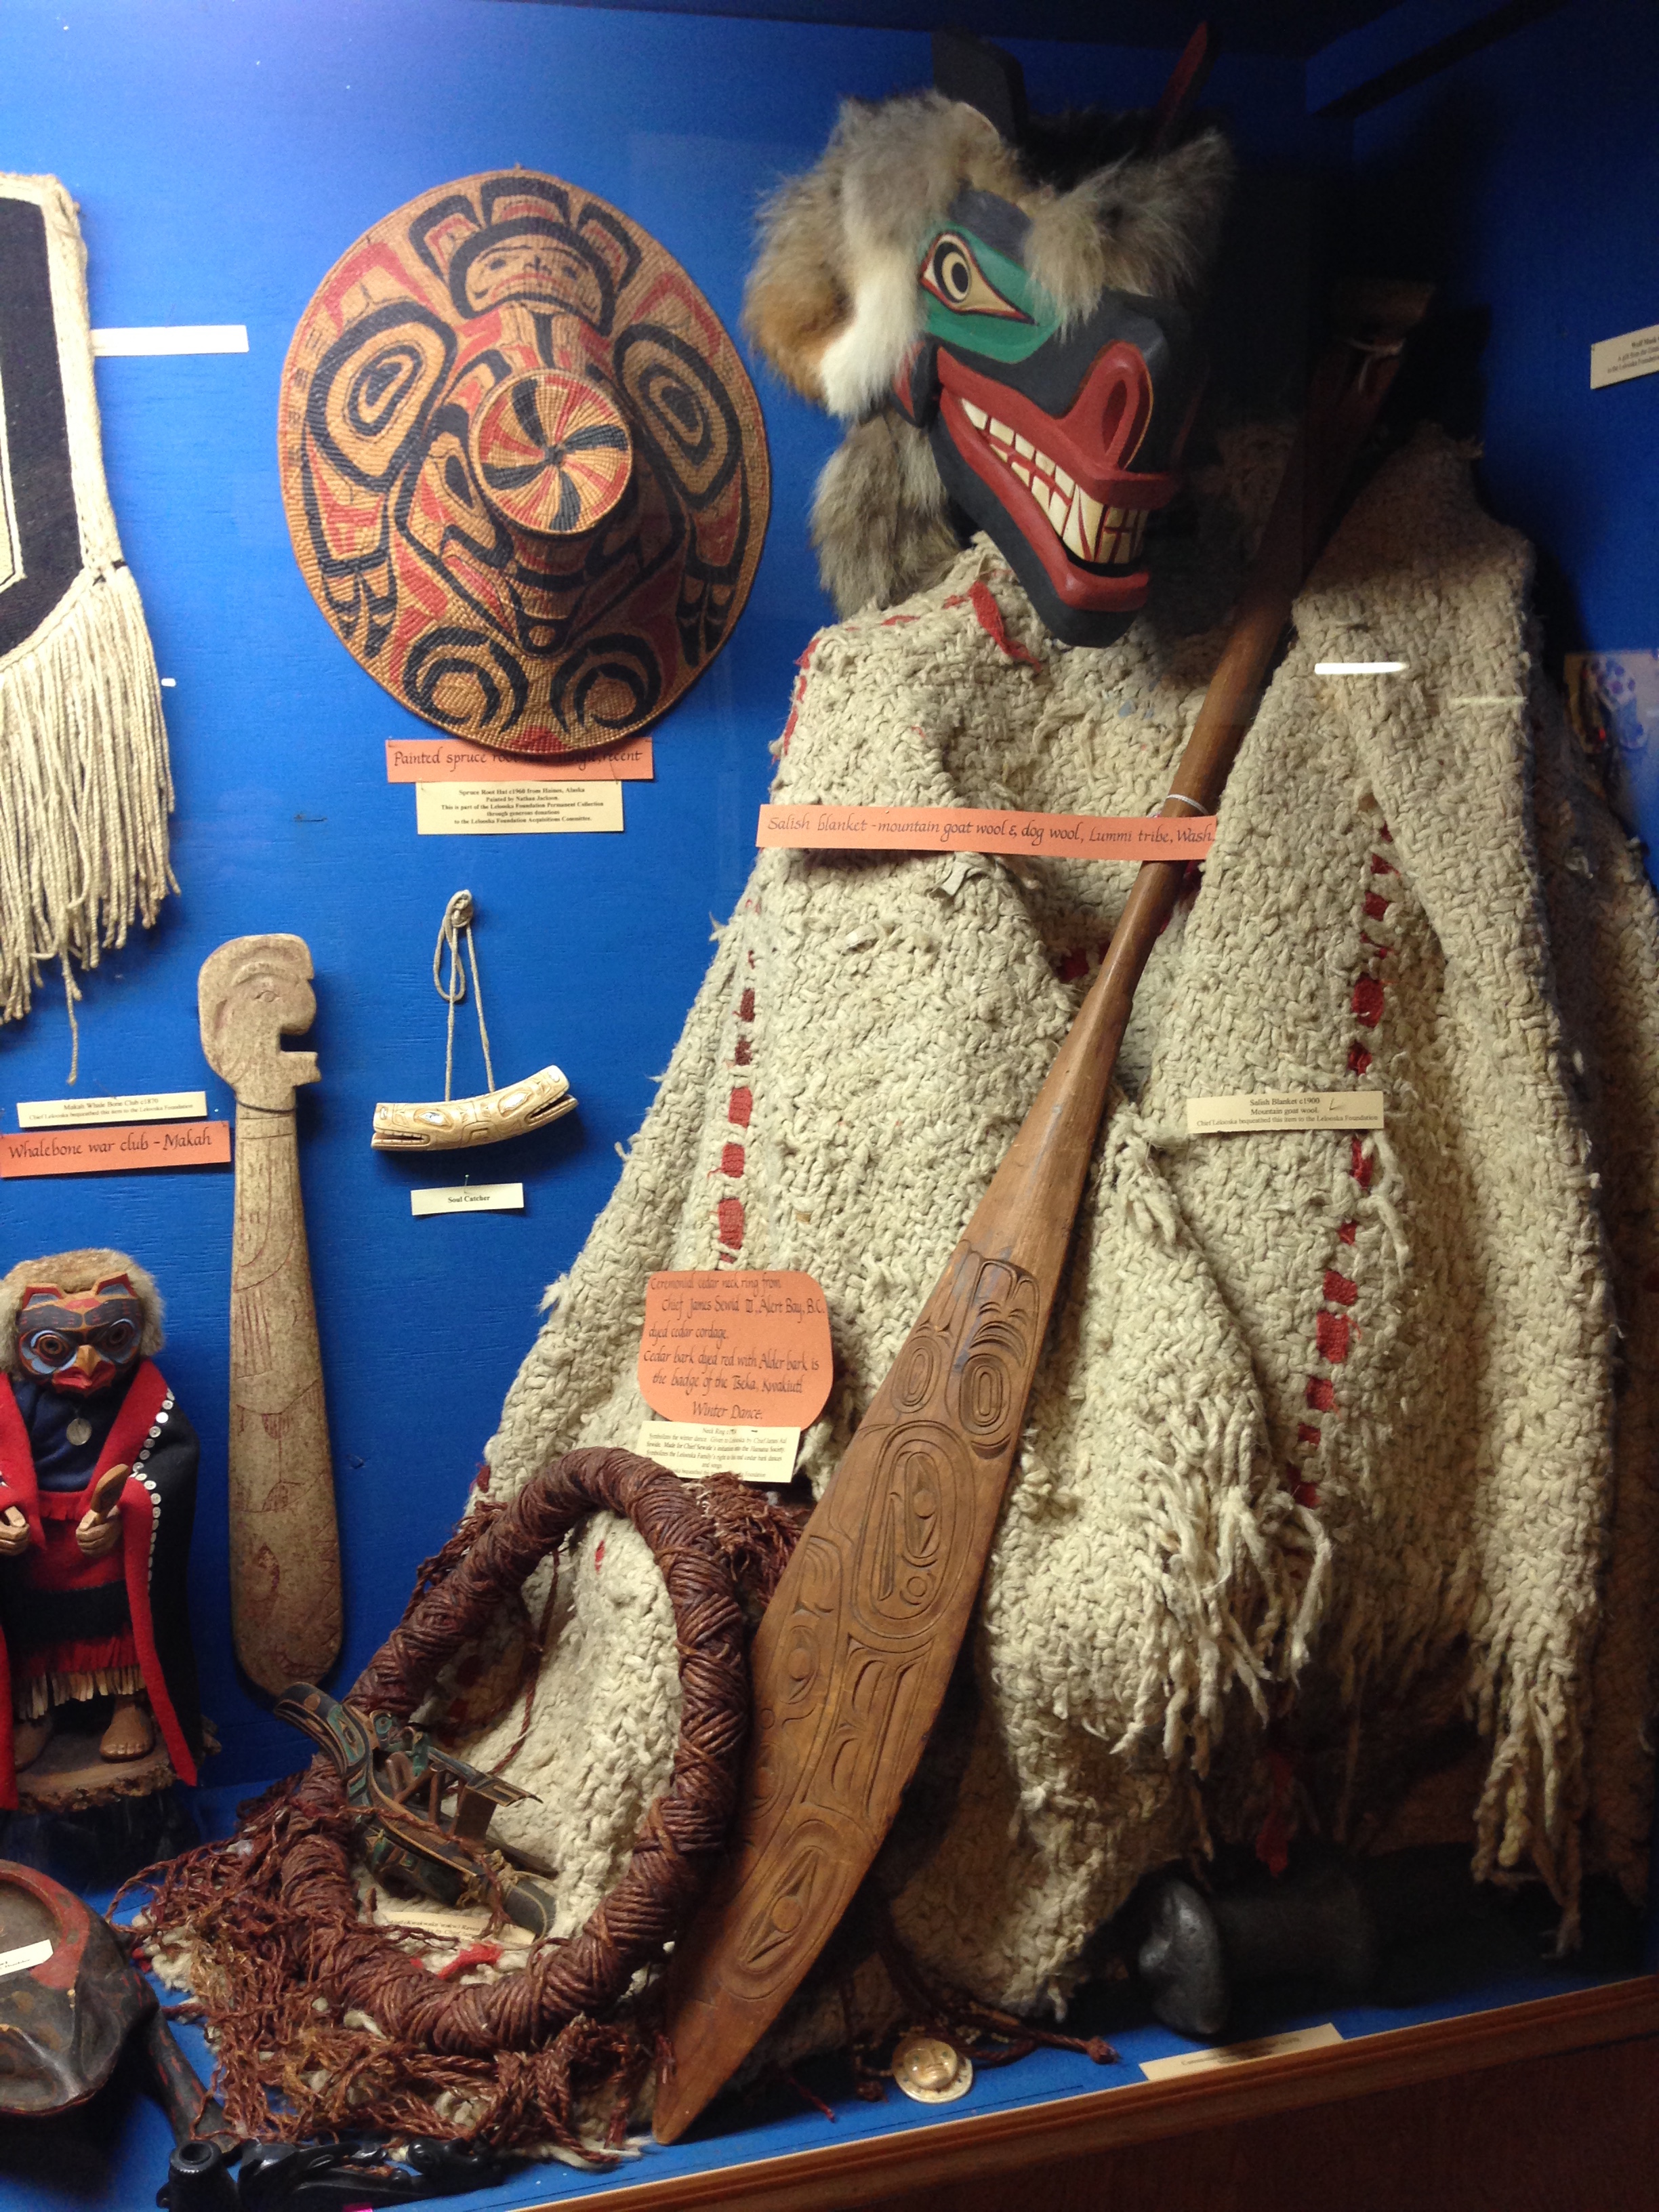
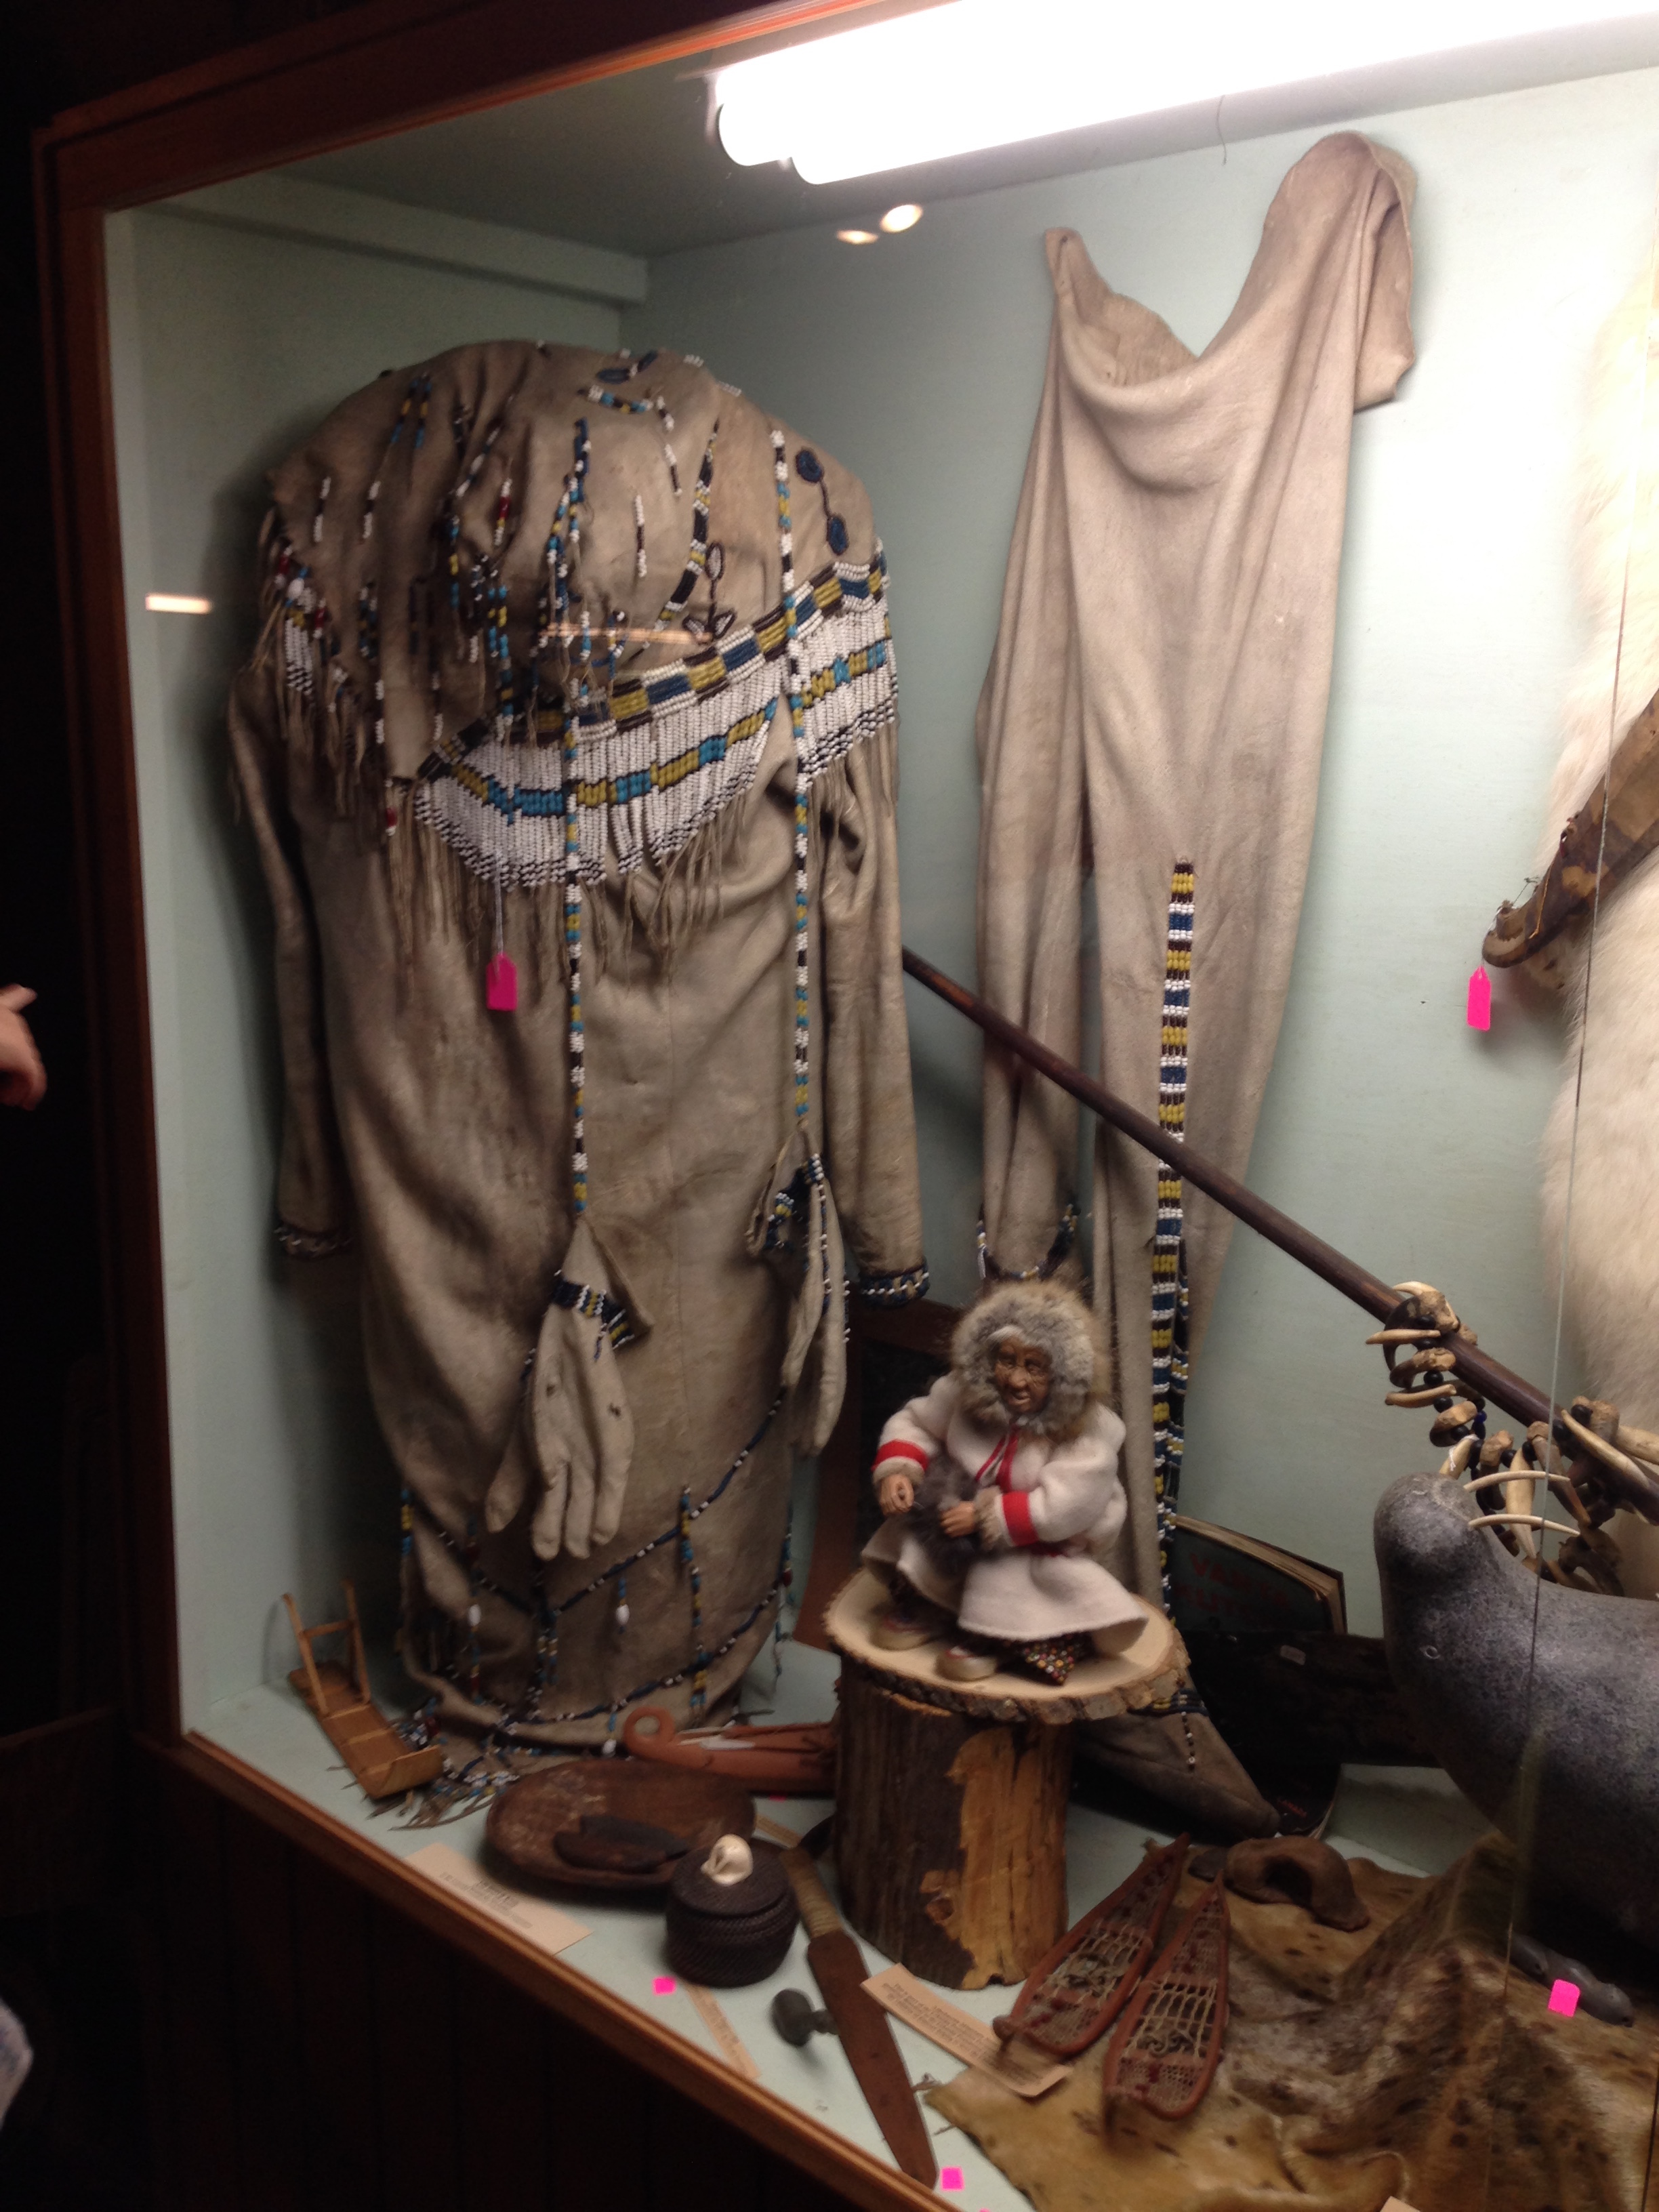
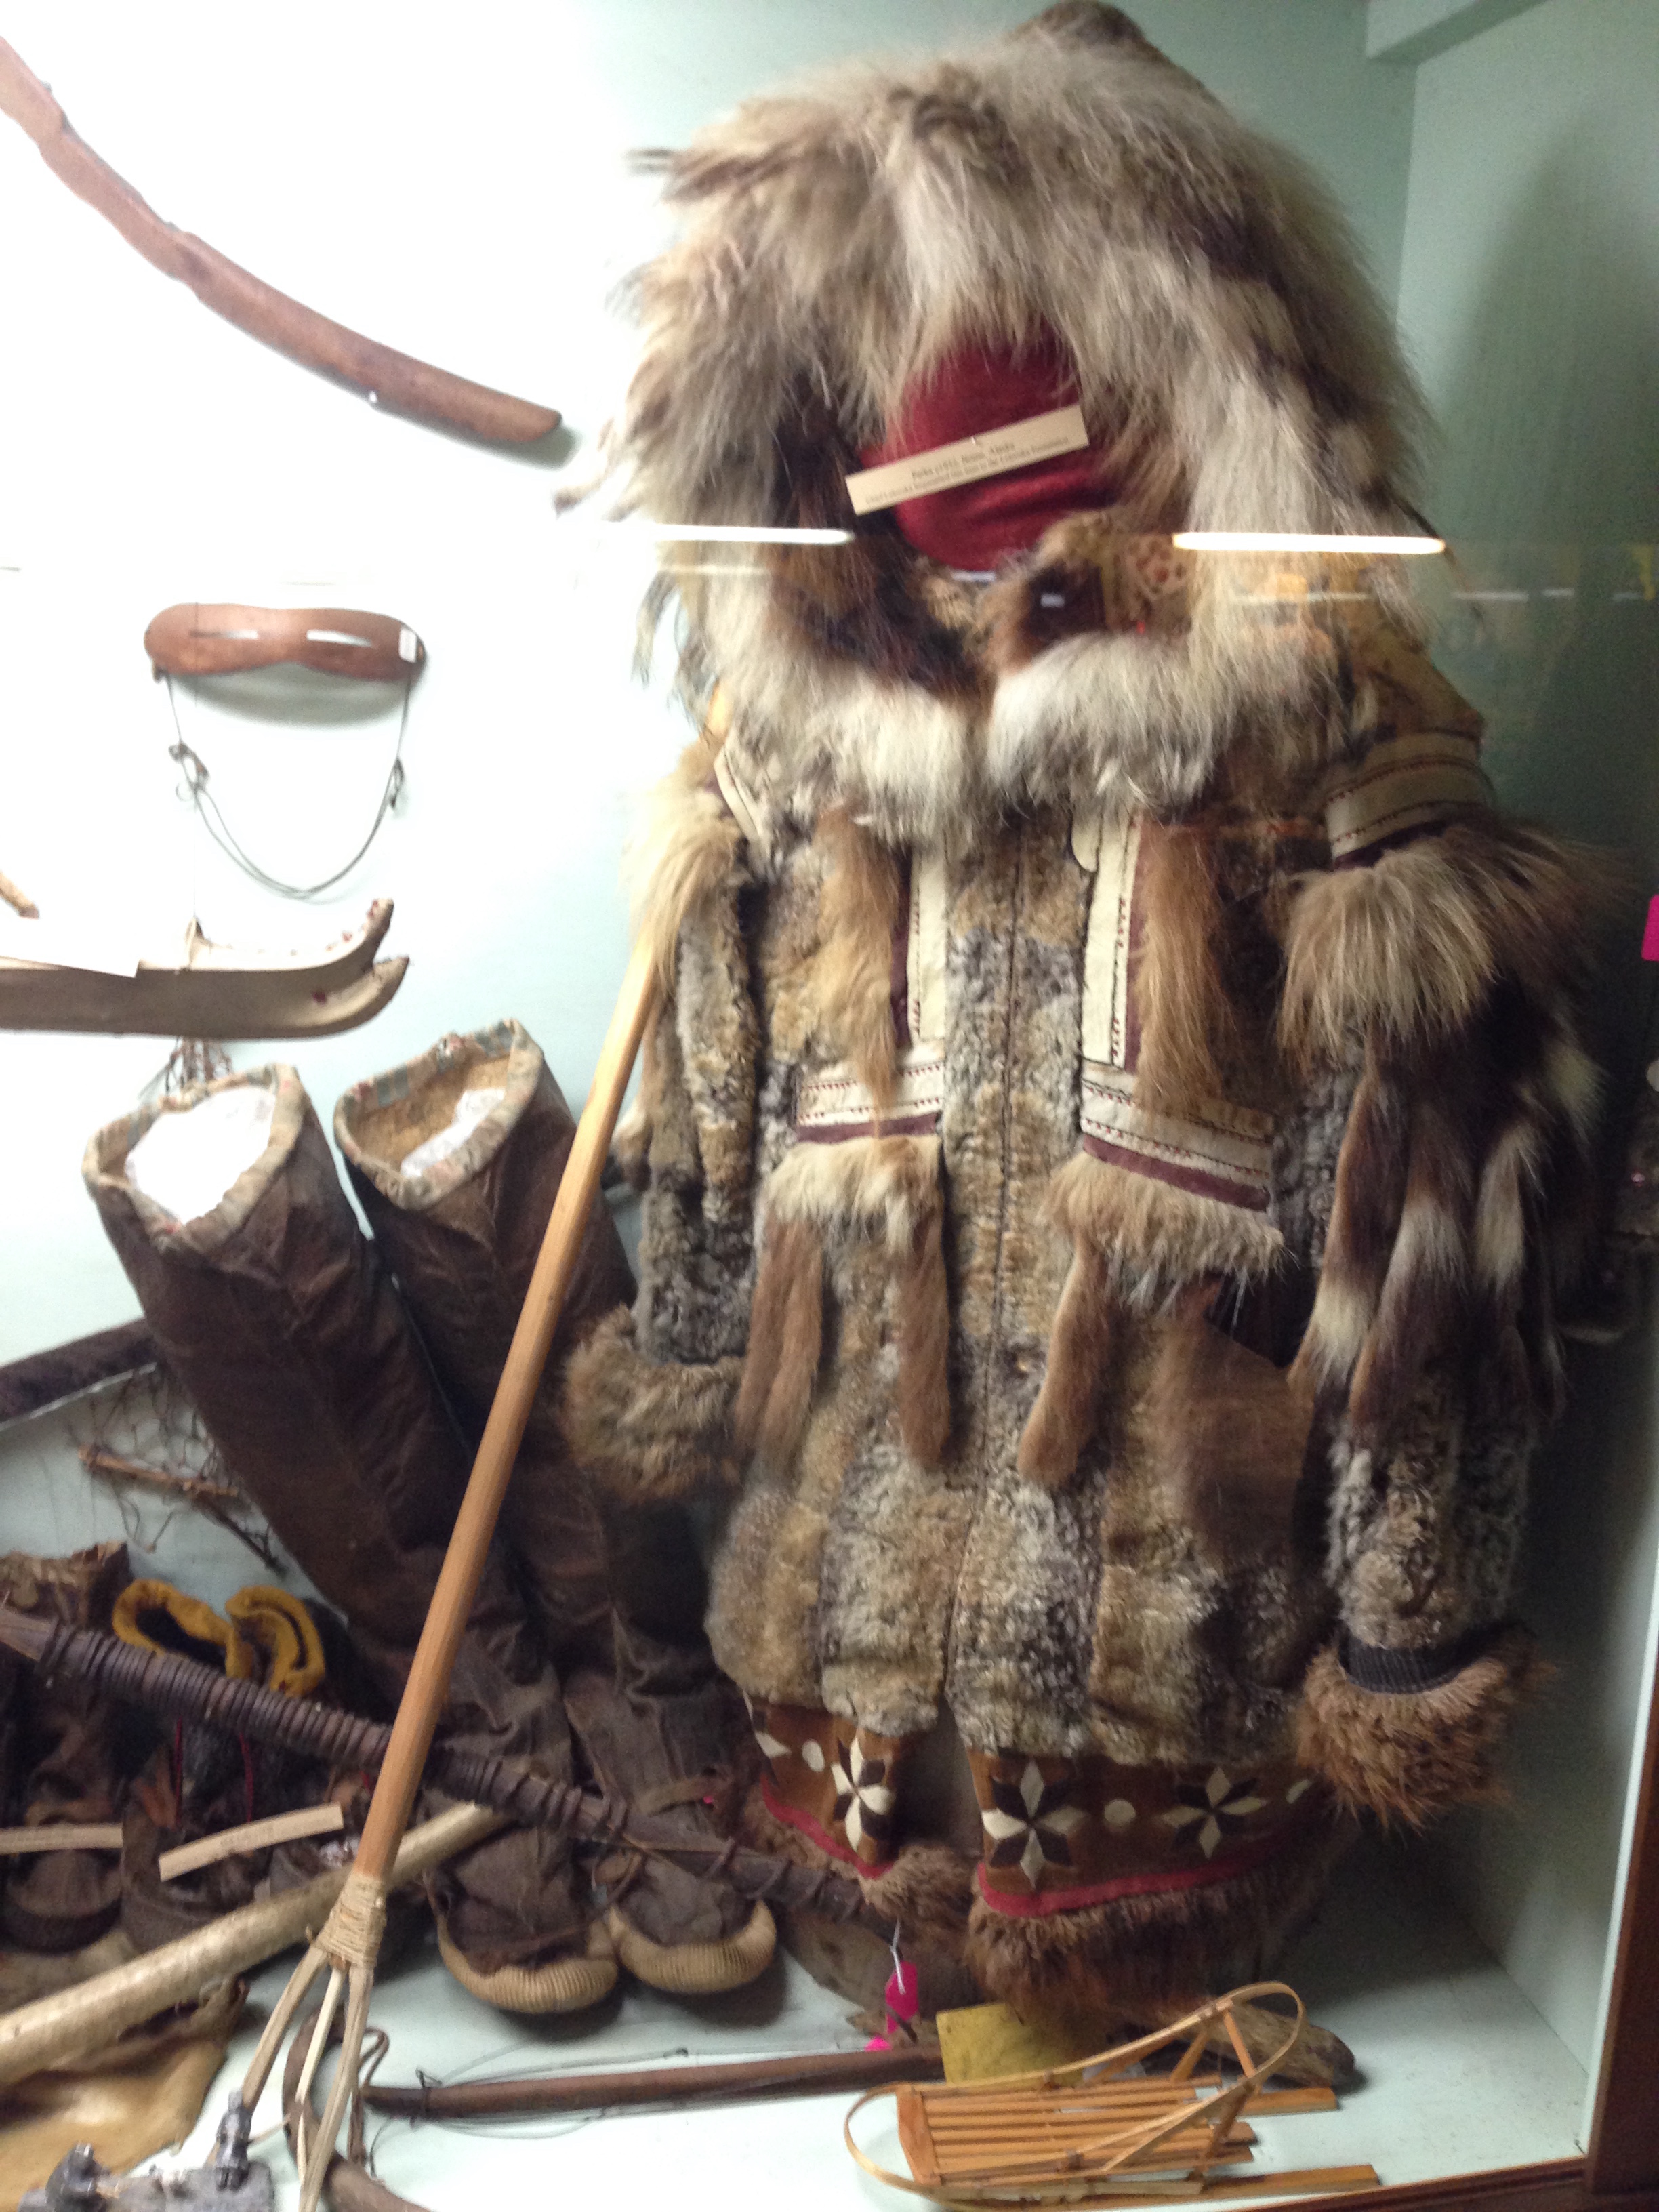
I'm on the board of directors for the Lelooska Foundation, a group founded by Chief Lelooska in 1977 to preserve and share the cultural heritage of the Native Peoples of North America. They share their heriditary dances, songs, and masks in a variety of programs held at their site in Ariel, WA. To date, they've had over 200,000 school kids attend their school programs! The foundation has a museum that houses a small but significant collection of artifacts from across North America, and one of the past capstone groups built a data-logging system that helps them track the temperature and humidity of the cases within the museum:
There are a variety of ways that a team could support the organization again this year. For example, by building a "scavenger hunt" web app or phone app that visitors could use while in the museum or on the grounds, or an interactive app that could help explain objects in the museum and help visitors learn more, or an an app that visitors could use when walking the grounds outside of the museum and ceremonial house to learn more about native plants and their uses, etc. I can put interested students in touch with Mariah, the current Chief's daughter and Executive Director of the Foundation, to learn more about what might be useful.
Here again, if the project was approached in the right way it could have much wider applicability than just this particular museum. A scavenger hunt app could load information about the "hunt" from a Google Sheet on the web somewhere, for example, so that users wouldn't have to be tech savvy to create their own customized scavenger hunts. Then you could market it much more widely.
Analyzing Program-Development Data
As you may know, the BlueJ IDE has the ability to monitor its user's activities. If you opt in to their data collection scheme, BlueJ sends information back to a server at the University of Kent about virtually every keystroke and mouse click you make. It records information about program-editing activities, as well as compilations, debugger runs, use of the codepad and object workbench, etc. At this point, they have hundreds of millions of these user traces in their repository.
I am anxious to learn more about how a large group of novices work their way through the solution of a particular programming problem. I'm inspired by a couple of papers: One is by one of the BlueJ creators, and discusses the frequency and complexity of errors based on an analysis of the BlueJ trace archive.[1] The other is a paper from 2012 in which machine learning was used to find groups of students using similar strategies to develop programs.[2] In the second paper they captured a set of program states, and built a graph showing how students transitioned from one state to another. (Students tackled pieces of the solution in different orders, but they also behaved in interesting ways when they ended up stuck in "error states".)
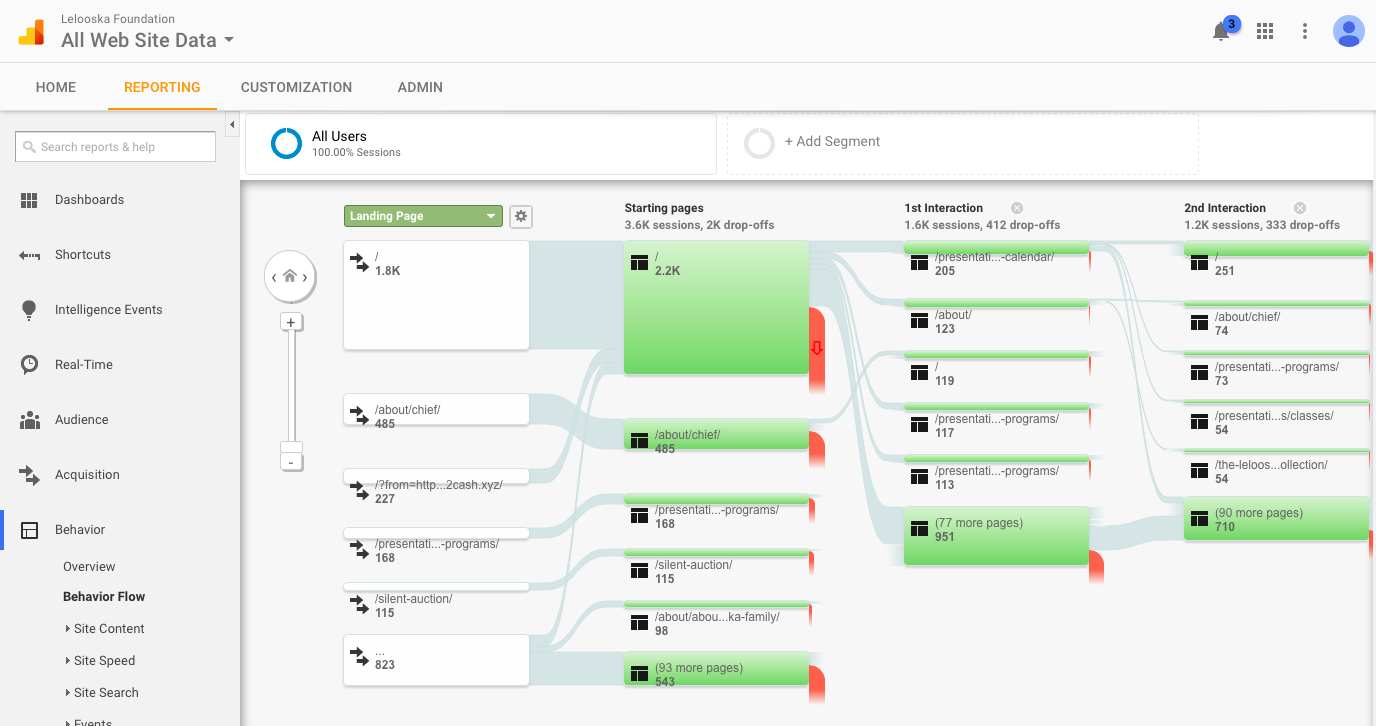
BlueJ's archive makes it possible to consider replicating something like this on a huge scale. (Millions of subjects rather than 2-300.) But there's quite a bit of infrastructure to be developed first: You would need to develop tools to interact with the BlueJ database, select appropriate program traces, and filter out any that aren't useful. (For example, maybe we only want to inspect traces for students who actually got it working.) The 2012 paper referenced above used compilation-time snapshots to drive their analysis, but the BlueJ data is much finer grained. You would need to traverse individual traces and turn them into sequences of more significant program-development states. Eventually it would be interesting to do some big-data analysis on the resulting sequences, but for now I'd be thrilled just to be able to see these flows somehow. Perhaps by converting them into a form that could be imported into Google's Behavior Flow tool, or something similar.
I posed this as a project the last time I ran Capstone and a team attempted this but fell pretty far short. In the end they were able to at least download some data and start visualizing it, but not in the ways I'd hoped. You can see their writeup in the collection of old project submissions.
Learning Analytics Tools
There's a lot of interest in Learning Analytics in the education community these days — it's essentially data science being applied to data drawn from educational settings. The BlueJ project above is a good example. The data that BlueJ collects can be used to inform research studies to learn more about how novices learn to program, what kinds of mistakes are most common, what kinds of behaviors predict success, etc. In previous research projects I've developed tools for collecting and analyzing BlueJ trace data and contributed to some of these research questions, but I've had to create my own custom data formats for storing trace data. The ProgSnap project has proposed a standardized representation for data collected from tools like BlueJ. If more researchers adopted this common format research teams could exchange data sets easily, and create "open" analysis tools that could work with the format. Interested students could contribute to this effort in several different ways:
- Building a tool to convert my custom trace data into ProgSnap format
- Converting my analysis tool(s) to use ProgSnap data
- Building a new tool for collecting BlueJ data and exporting as ProgSnap
That last suggestion, for example, could involve a user-friendly interface that collections information from the user about the names of the BlueJ projects they'd like to analyze, or a range of dates from which traces should be drawn, or details of the traces of interest (e.g. traces where a student uses the debugger). It would generate the appropriate SQL queries to retrieve these traces, pose them remotely to the server in the UK, collect the results, and write them to disk in ProgSnap format.
Brad Richards, 2021